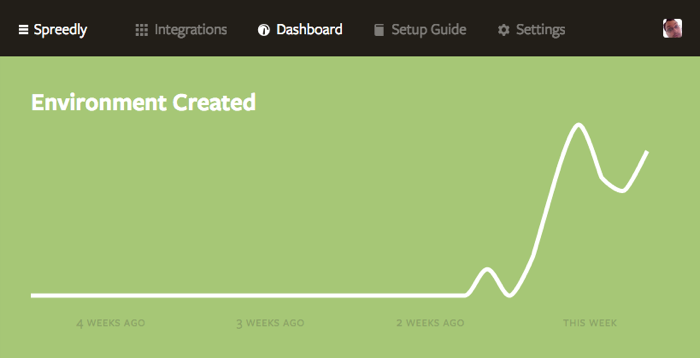
I’ve spent the last couple of weeks hooking up a bunch of monitoring and analytics to our systems at Spreedly. It’s long overdue, but with the big launch of our new messaging we needed more data so we weren’t flying blind and could make decisions going forward based on hard numbers. The work has encompassed both business metrics (page views, signups, subscriptions, …) and devops metrics (response times, request counts, …).
I’ll admit, we’ve tried to do this a couple of times before, and every time I’ve been stymied by two things: first, the overwhelmingness of both trying to choose between a lot of well regarded options, and at the same time trying to figure out what we should be tracking. Second, hooking up metrics is not a trivial task, and when there are other things I can be doing that at least appear to add more value to the bottom line, I tend to quickly get distracted and pulled back into “regular work”.
The big difference this time around was that I found a couple of tools that cut way down on the difficulty of getting started, and I’m super excited to tell you about them.
Biz Metrics - Segment.io

Remember how I mentioned having lots of interesting choices, but being overwhelmed trying to pick? Using Segment goes a long way towards solving that problem. To put it in the terms of my day-to-day world, Segment is basically the “Spreedly of Business Analytics” - you hook up one time to Segment’s API, and then you can turn on dozens of different services in your site with just a quick configuration change in their dashboard.
This had two huge advantages for me: first, it simplified the API that I had to implement against, since by looking at a whole pile of API’s and building a solid over-arching API, Segment has come up with something incredibly simple and easy to use. They also have a library for just about any language, making the implementation even easier.
The second big advantage with Segment is that it makes it a cinch to trial multiple analytics services simultaneously and see which one(s) are the best fit. Tools like KISSmetrics and Mixpanel aren’t cheap, and yet they take a fair amount of effort to integrate from scratch. Using Segment in front means I can trial them in parallel without biting off two significant integration efforts.
And speaking of KISSmetrics and Mixpanel: both tools are pretty awesome. Justin is like a kid in a candy store, taking the raw information and events filtering in and building out all kinds of interesting funnels, counters, and segments. And I can tell he’s deep in the numbers, since he keeps finding places where I’m counting things wrong!
Devops Metrics - Librato
The biggest stumbling block to me with devops metrics has always been how many moving pieces there are. You have to figure out what to collect, collect it somehow, get it into some kind of data store, then hook up something to consume that data and eventually expose it in some kind of useful format. It’s all a bit overwhelming when you’re just getting started, and at the local Devops Meetup I was explaining some of my frustration to a few sympathetic ears from Github and Heroku, which both have excellent internal devops metrics.
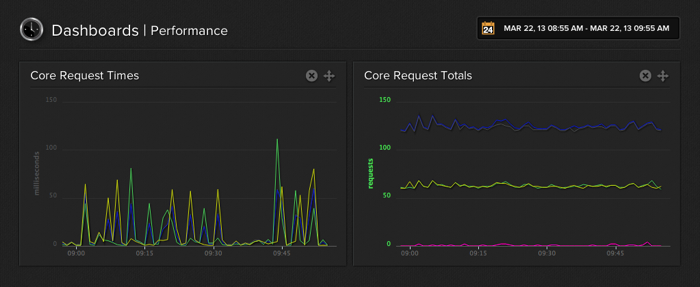
One of them suggested I get started with Librato, and boy am I glad they did. Leveraging Librato’s awesome librato-rails gem, I had some basic metrics showing up in a dashboard within a few hours of getting started. And since Librato is taking care of the infrastructure, I’m in a great place to add more metrics and incrementally increase our visibility into the health of our infrastructure.
We’ve always had some visibility into our business metrics and our infrastructure, but like so many things when you’re in startup mode, it was one kludge after another. It’s so exciting to feel like we’re on a solid footing now, both in terms of having better metrics today and in being able to iteratively expand what we’re monitoring going forward.